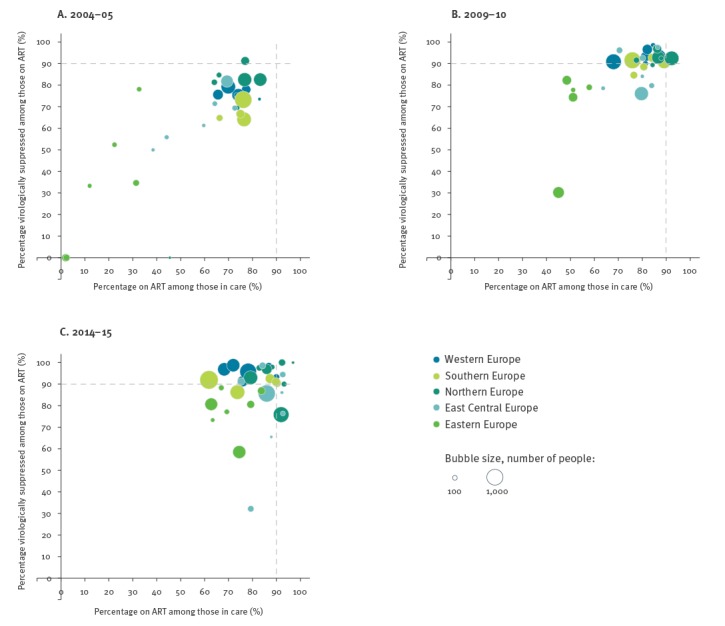
Figure 1.
Country-specific estimates of the percentage of people on ART among those in care, and percentage of people virologically suppressed among those on ART, EuroSIDA study, 2004–05, 2009–10 and 2014–15
ART: antiretroviral treatment.
Each bubble represents a country and the area of the bubble is proportional to the number of people under follow-up in each country. Virological suppression was defined as HIV RNA < 500 copies/mL. The two dotted lines indicate 90% of those in care on ART (x-axis) and 90% virologically suppressed among those on ART (y-axis). Individual country estimates based on fewer than 30 people are not shown.

