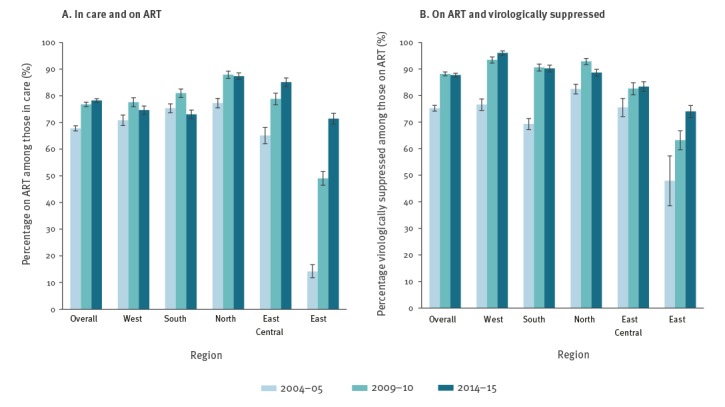
Figure 2.
Temporal trends in unadjusted estimates of the percentage on ART among those in care and percentage virologically suppressed among those on ART by region and overall, EuroSIDA study, 2004–05, 2009–10 and 2014–15
ART: antiretroviral treatment.
Bars indicate 95% confidence intervals. Virological suppression was defined as HIV RNA < 500 copies/mL.

