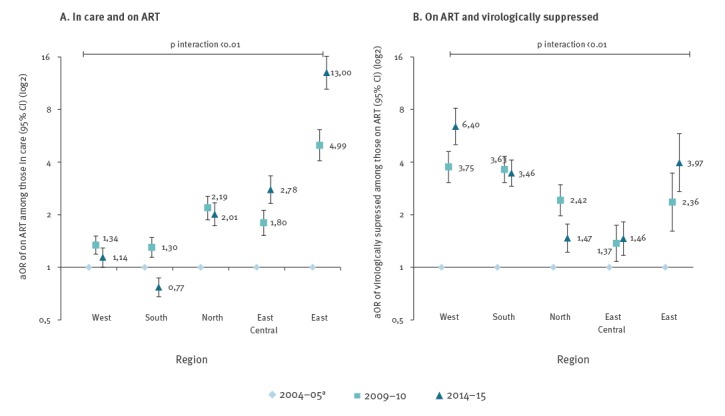
Figure 3.
Adjusted odds ratio of being on ART among those in care and of being virologically suppressed among those on ART in 2009–10 and 2014–15 compared with 2004–05 by region, EuroSIDA study
ART: antiretroviral treatment; aOR: adjusted odds ratio; CI: confidence interval.
a 2004–05 reference.
Odds ratios are on a log2 scale. Virological suppression was defined as HIV RNA < 500 copies/mL. Adjusted for current age, sex, risk group, CD4+ T-cells at entry into EuroSIDA, current hepatitis B status, current hepatitis C status.

