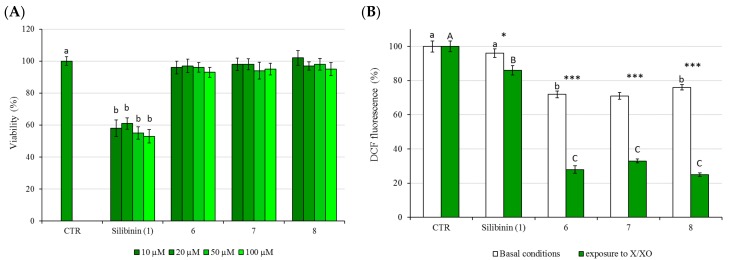
Figure 2.
(A) The effects of 24 h treatment on HepG2 cell viability as determined by MTT assay. Different letters indicate significant differences among control and different concentrations (One way ANOVA, p < 0.05); (B) Protection against XO-induced intracellular ROS generation: DCF fluorescence was measured in basal conditions (white bars) or following cells exposure to X/XO system for 3 h (green bars). The cells were pretreated with each dimer (6–8) at concentrations of 20 μM. The values are expressed as % compared to the fluorescence value observed in control untreated cells which was set at 100. Asterisk indicates significant differences between basal conditions and exposure to X/XO, *: p < 0.05, ***: p < 0.001; different letters indicate significant differences among control, silibinin (1), 6, 7 and 8 within basal conditions and exposure to X/XO (Two way ANOVA).

