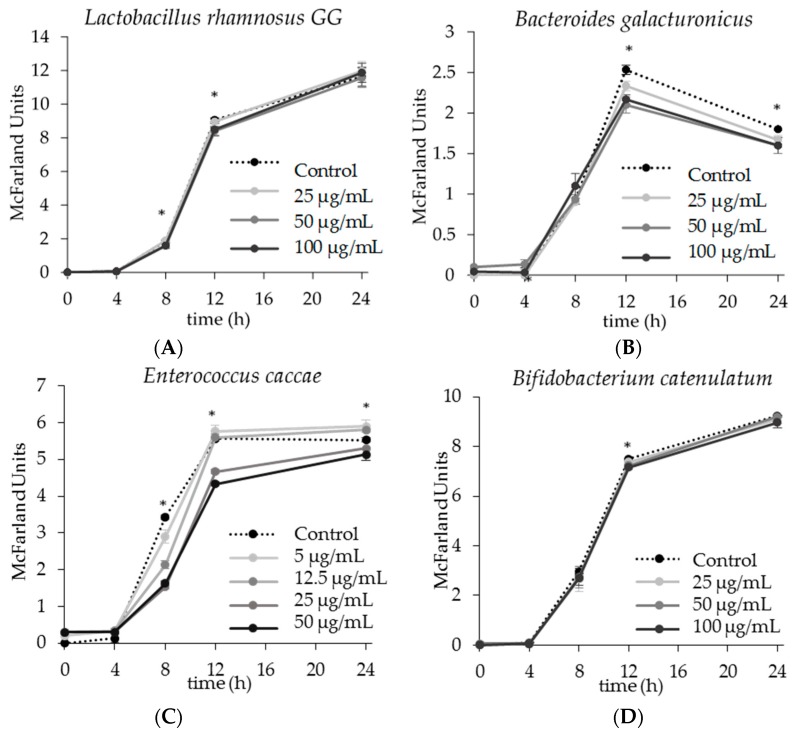
Figure 2.
The effect of apigenin on the growth of single gut bacterial strains. Bacteria were inoculated in strain-specific media containing apigenin. McFarland unit values were determined using a densitometer at 0, 4, 8, 12, and 24 h post inoculation. The dotted line represents the control group in which bacteria grew with no apigenin added. The * mark indicates at least one experimental group was statistically significant from the control at that time point (p < 0.05). The 24 h growth curve with increasing concentrations of apigenin for (A) Lactobacillus rhamnosus GG; (B) Bacteroides galacturonicus; (C) Enterococcus caccae; (D) Bifidobacterium catenulatum.

