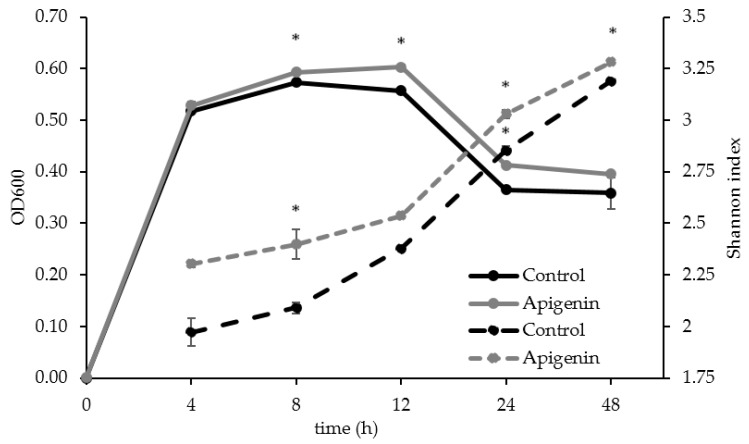
Figure 3.
Culture density and alpha diversity over time. The culture density for the control and apigenin (100 µg/mL) treated groups based on the OD600 reading over time is represented using the left axis. The alpha diversity based on the Shannon index is represented using the right axis. The * mark indicates at least one experimental group was statistically significant from the control at that time point (p < 0.05).

