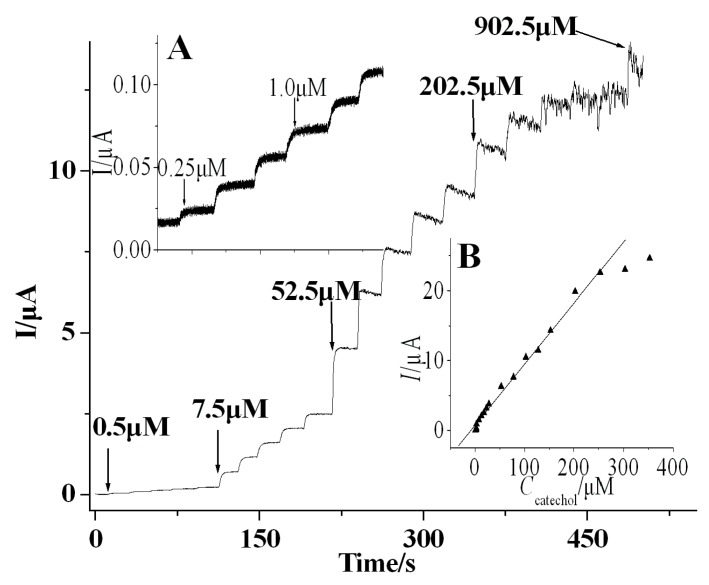
Figure 6.
Amperometric responses of the Nafion/Tyr/EGR-AuNPs-Ch/GCE at −0.10 V (vs. SCE) upon successive addition of 0.5 μM, 7.5 μM, 52.5 μM, 202.5 μM, and 902.5 μM CA in PBS. Inset: (A) amperometricresponses of the Nafion/Tyr/EGR-AuNPs-Ch/GCE at 0.20 V (vs. SCE) upon successive addition of 0.25 μM and 1.0 μM CA in PBS; and (B) plot of peak current vs. CA concentration.

