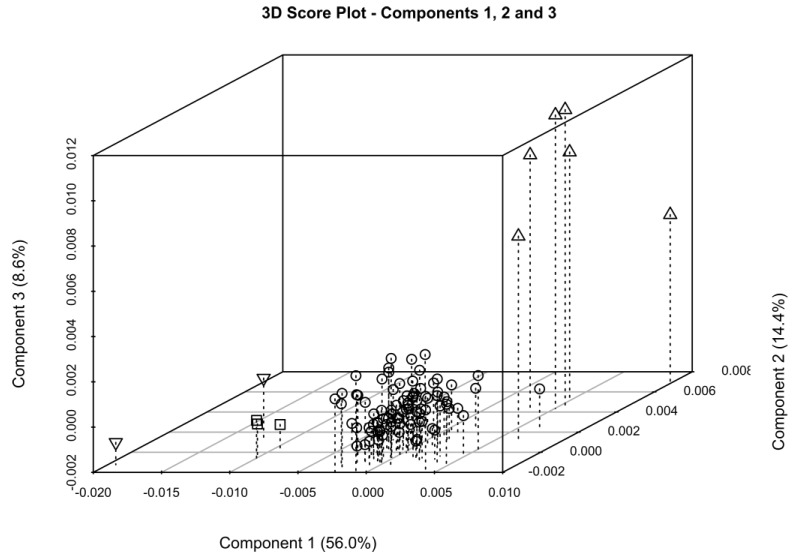
Figure 7.
Three-dimensional (3D) Score plot generated by PCA of part of the anomeric signals region. Sample clusters corresponding to the different families of crude heparin are defined. BMHC (above pointing triangles), OMHC (squares) and BLHC (below pointing triangles), against the library of PMHC (circles).

