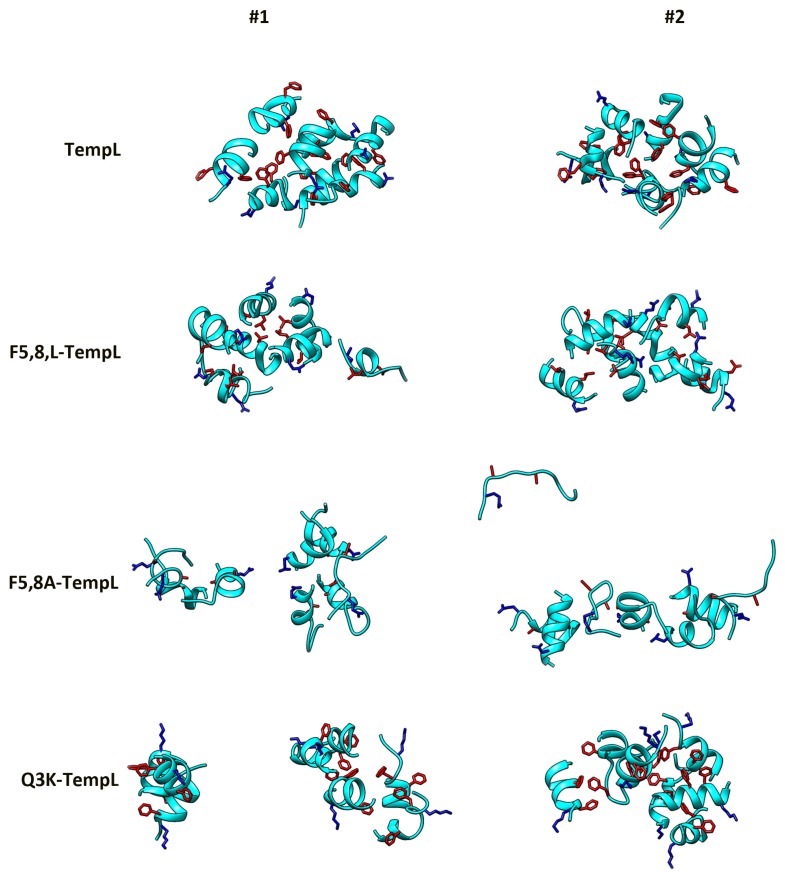
Figure 1.
Final structures of the MD simulations in water. For each peptide (TempL, F5,8L-TempL, F5,8A-TempL and Q3K-TempL from the top) the structures from two independent simulations are reported. Peptides are represented as cyan ribbon; and residues 3, 5 and 8 are reported in stick representation (blue for Q/K residues at position 3 and red for the F/L/A at positions 5 and 8).

