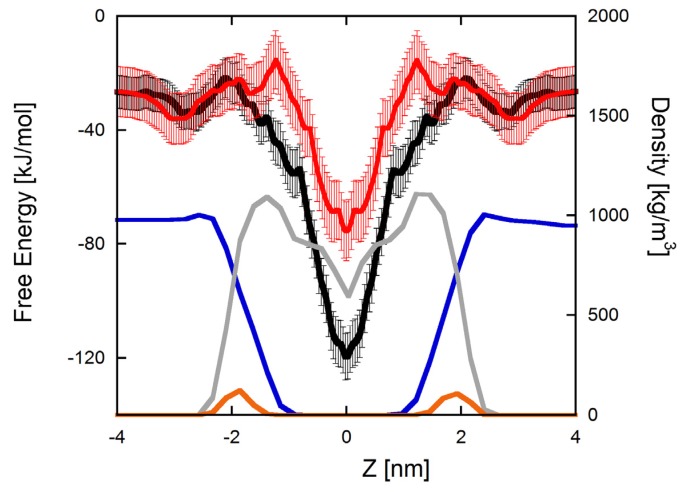
Figure 2.
PMF profiles of the insertion of TempL (black) and Q3K-TempL (red) into a bilayer formed by Lipid-A. As reference, the density profiles of different parts of an unperturbed lipid-A bilayer are also reported. In particular, the water density profile is reported in blue and that of lipid tails and phosphate groups are reported in gray and orange, respectively. Roughly, the two peaks of the phosphates represent the boundaries of the membrane environment.

