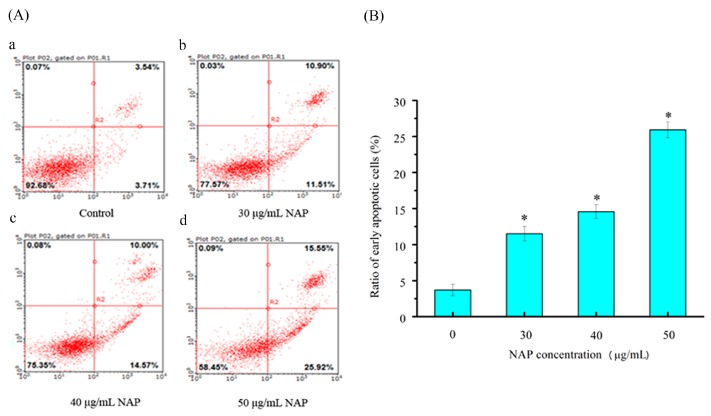
Figure 4.
The apoptotic effect of NAP on H1299 cells. (A) Flow cytometry analysis of H1299 cells by double-labeling with Annexin-V fluorescein isothiocyanate (FITC) and PI. Annexin-V and propidium iodide (PI). Quadrants: lower left-live cells; upper left-necrotic cells; lower right-early apoptotic cells; upper right-late apoptotic cells. The percentage of early apoptotic cells was 3.71% (a) in the negative control cells; 11.51% (b) in the 30 μg/mL NAP-treated cells; 14.57% (c) in the 40 μg/mL NAP-treated cells and 25.92% (d) in the 50 μg/mL NAP-treated cells; (B) The percentage of apoptotic cells. All data are presented as the mean ± standard deviation (SD) of three experiments. * p < 0.05 vs. control.

