Figure 8.
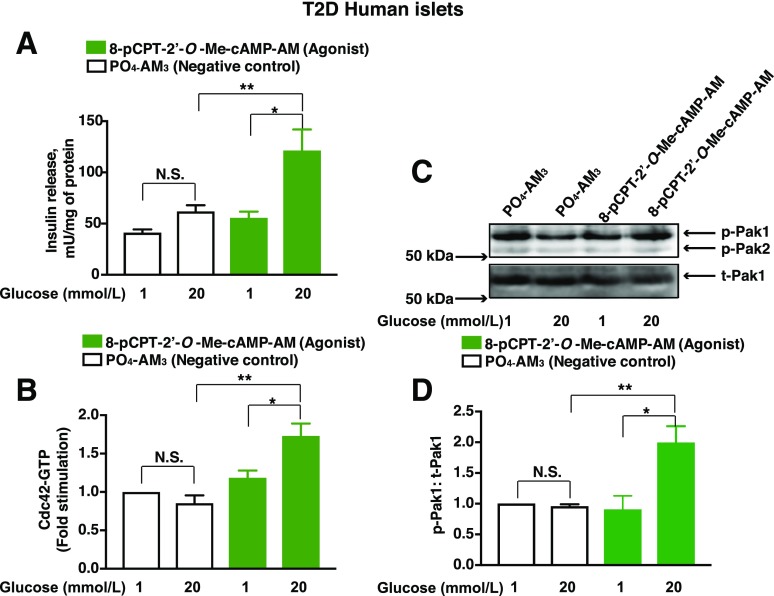
Restoration of Cdc42-Pak1 activation and GSIS in human T2D islets by Epac activator 8-pCPT-2′-O-Me-cAMP-AM. A: T2D islets were pretreated for 20 min with low-glucose solutions containing PO4-AM3 (3.3 μmol/L) or 8-pCPT-2′-O-Me-cAMP-AM (10 μmol/L). Islets were then exposed for 30 min to KRBH containing either a low-glucose (1 mmol/L) or high-glucose (20 mmol/L) concentration, and the supernatants were collected to measure insulin released into the media. Data represent the mean ± SEM from three independent experiments; *P < 0.05 vs. 1 mmol/L glucose treated with 8-pCPT-2′-O-Me-cAMP-AM and **P < 0.05 vs. 20 mmol/L glucose treated with PO4-AM3. B and C: T2D islets were pretreated for 20 min with low-glucose solutions containing PO4-AM3 (3.3 μmol/L) or 8-pCPT-2′-O-Me-cAMP-AM (10 μmol/L). Islets were then exposed for 2 min (B, Cdc42 activation) or 5 min (C, Pak1 activation) to KRBH containing either a low-glucose (1 mmol/L) or high-glucose (20 mmol/L) concentration prior to their lysis. Cdc42-GTP was quantified by the G-LISA method. Data represent the mean ± SEM from three independent experiments: *P < 0.05 vs. 1 mmol/L glucose treated with 8-pCPT-2′-O-Me-cAMP-AM and **P < 0.05 vs. 20 mmol/L glucose treated with PO4-AM3. C: Representative immunoblots from one of three experiments demonstrate the phosphorylation of Pak1 (p-Pak1) (C) vs. total Pak1 (t-Pak1) (D). Densitometry analysis of n = 3 independent experiments, shown as the mean ± SEM; *P < 0.05 vs. 1 mmol/L glucose with 8-pCPT-2′-O-Me-cAMP-AM and **P < 0.05 vs. 20 mmol/L glucose treated with PO4-AM3. N.S., not significant.

