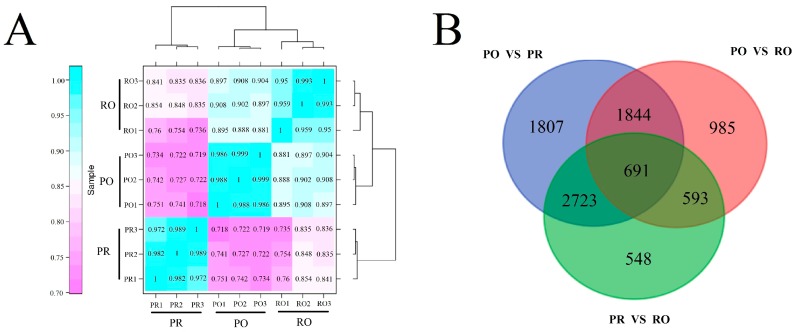
Figure 4.
Gene expression profiles in three differentially colored tree peonies. (A) Cluster dendrogram of gene expression profiles between biological replicates and among different tree peonies. The color scale represents Pearson correlation coefficients among different samples. The higher the Pearson correlation coefficient, the closer the relationship between two libraries is. The blue represents a closer relationship, and pink represents a distant one transcriptome relationship between different samples; (B) Comparison in pairs of differentially expressed genes (with an FDR < 0.001 and a |log2 ratio| > 1) in different groups. The Venn diagram depicts the overlaps between each pairwise comparison. The Venn diagram was constructed online using Venny (http://bioinfogp.cnb.csic.es/tools/venny/).

