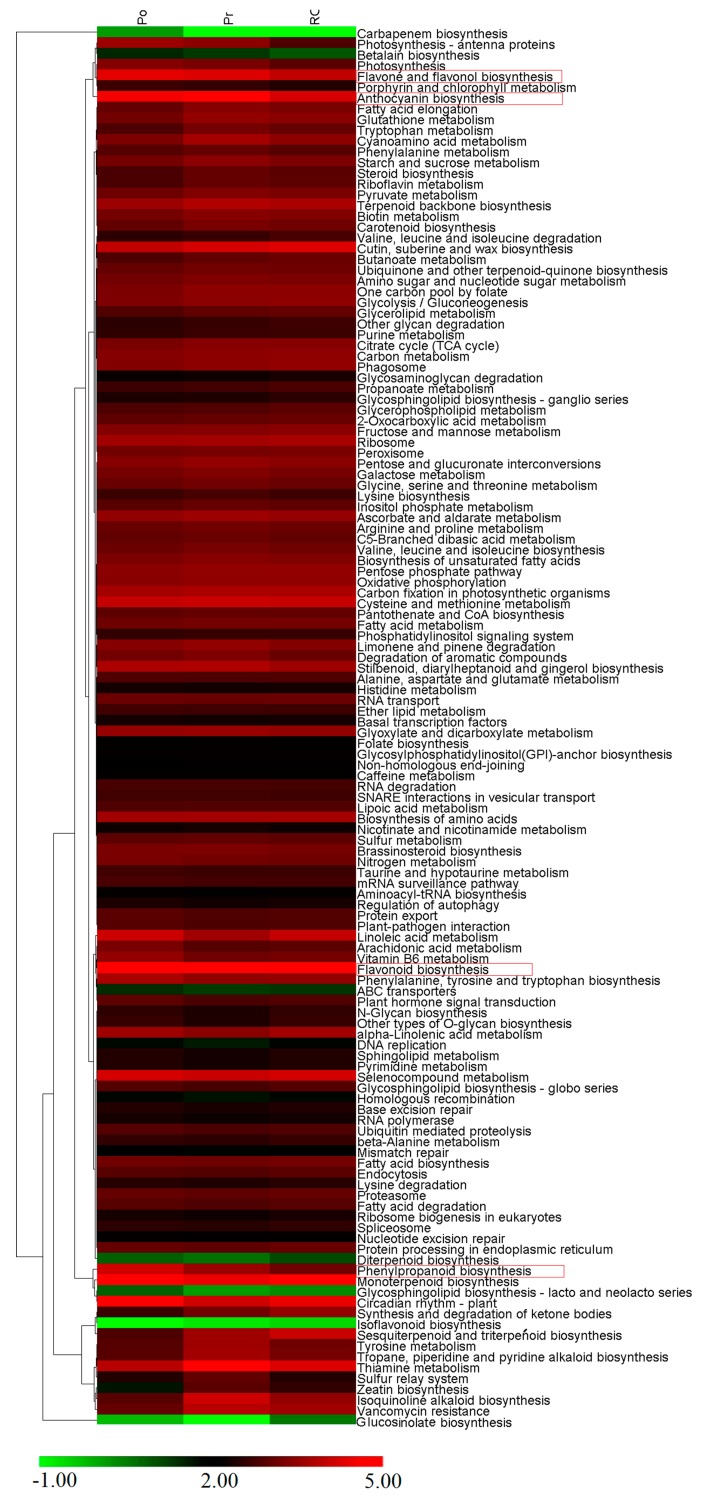
Figure 5.
Expression profiles of 130 KEGG pathways. The heatmap is generated according to the average expression levels of the genes in each pathway based on log ratio FPKM data. The color scale represents log2 transformed FPKM values. Green indicates low expression, and red indicates high expression.

