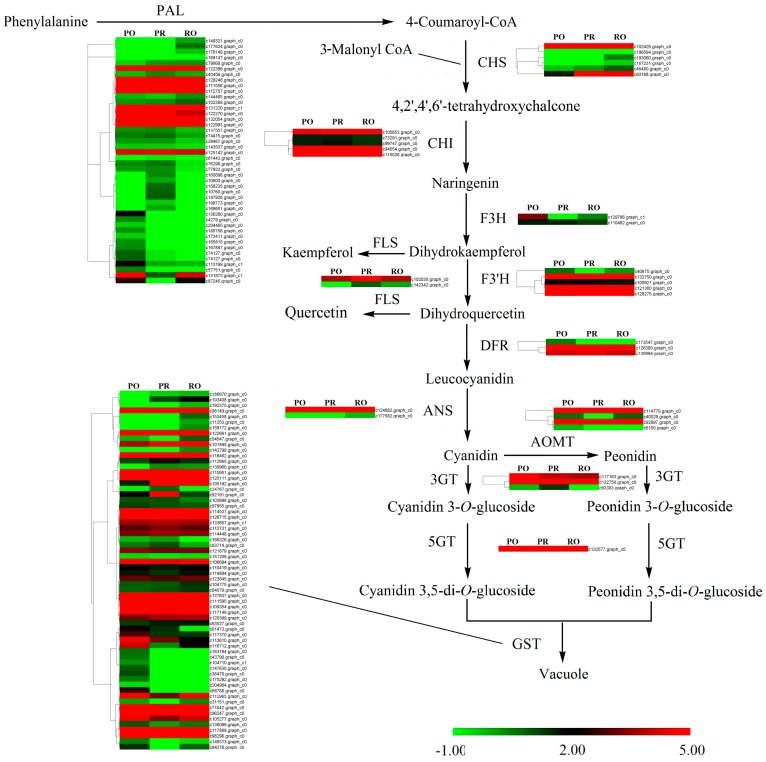
Figure 6.
A detailed schematic of anthocyanin metabolism related to flower pigmentation in PO, PR and RO. Enzyme names and expression patterns are indicated beside each step. The expression pattern of each gene is shown in a heatmap. The color scale represents log2 transformed FPKM values. Green indicates low expression, and red indicates high expression.

