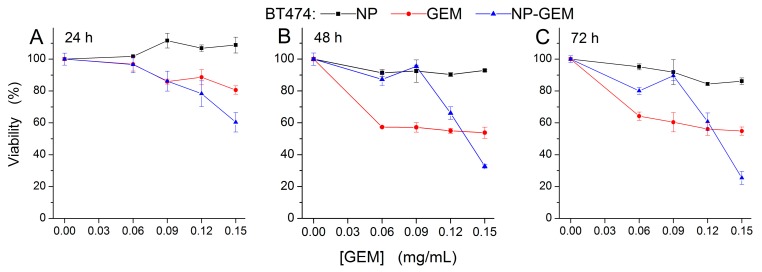
Figure 7.
Cell viability of BT-474 cells, incubated with free GEM and Fe3O4@GEM (equivalent GEM concentrations), determined at (A) 24 h; (B) 48 h and (C) 72 h after the treatment. Data are expressed as percentage of the untreated control. Two-ways ANOVA statistical analysis revealed a significant difference between the GEM and NP-GEM experimental conditions (F(1) = 11, p < 0.01 at 24 h; F(1) = 118, p < 0.001 at 48 h; F(1) = 9, p < 0.01 at 72 h;). The GEM concentration variation along the investigated range produced significant reduction of the viability (F(4) = 33, p < 0.001 at 24 h; F(4) = 305, p < 0.001 at 48 h; F(4) = 219, p < 0.001 at 72 h) irrespective of nanoparticles presence.

