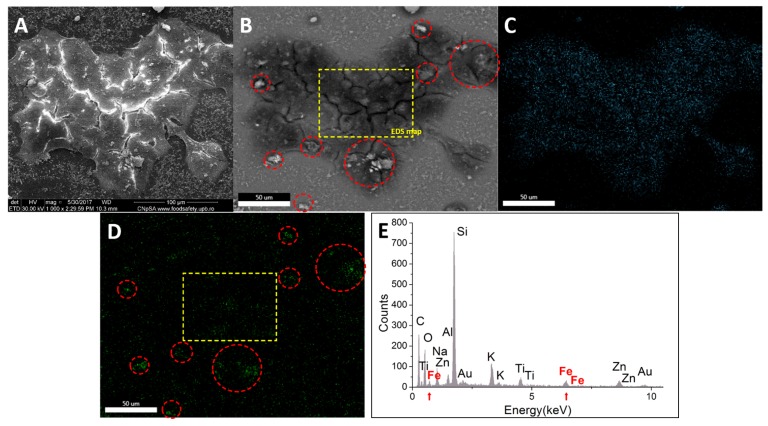
Figure 17.
Qualitative and quantitative elemental characterization of BT 474 cells exposed to the highest concentration of Fe3O4@GEM, after 24 h of treatment: (A) morphology image resulted using secondary electrons signal (magnification 1000×); (B) morphology image resulted using back scattered electrons signal (magnification 1000×); (C) carbon elemental mapping on B; (D) iron elemental mapping on B; (E) EDX spectrum on B (yellow square); red circles mark the extracellular agglomerates of nanoparticles; yellow square marks an area free of extracellular nanoparticles, which was subjected to quantitative elemental analysis; red arrows mark the presence of Fe in the EDX subjected area.

