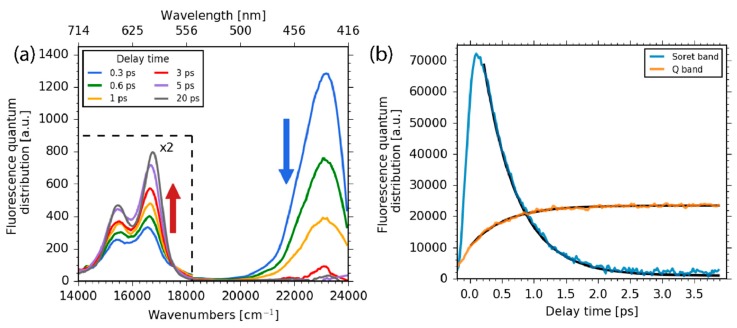
Figure 3.
(a) Fluorescence spectra for selected delay times. The decay of the Soret band (blue arrow) and the subsequent rise of Q band fluorescence (red arrow) is clearly visible. For delay times of 5–20 ps, the two Q band fluorescence peaks shift to higher frequencies; (b) The integrated fluorescence transient of the Soret band region from 417 to 500 nm (blue line) and mono-exponential simulation with a time constant of 0.5 ± 0.1 ps; integrated fluorescence transients of the Q band region (orange line) with a mono-exponential rise time constant of 0.5 ± 0.1 ps.

