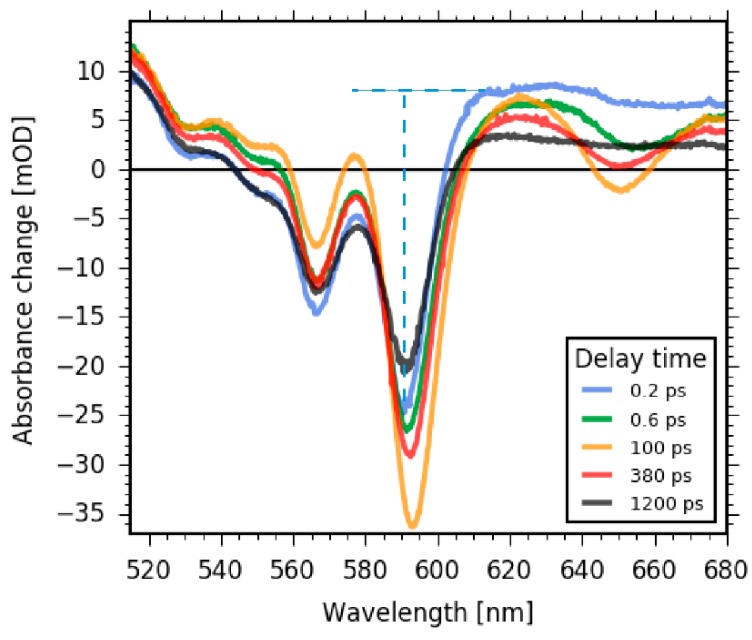
Figure 6.
Selected absorbance difference spectra displaying the rise and decay of Q band stimulated emission (SE) signals as well as the change in excited state absorption (ESA). Over short time scales, the formation of SE at 650 nm is clearly visible. Longer delay times show the decay of SE at 650 nm and the decay of ESA around 550 nm. At early delay times (0.2 ps, blue line), the height of the Soret band ESA at 590 nm can be estimated by way of the blue dashed horizontal line and the signal strength of the initial bleaching signal at 590 nm by way of the blue dashed vertical line to be about 32 mOD.

