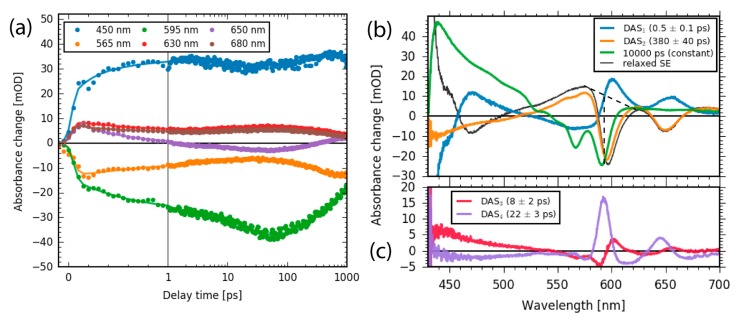
Figure 7.
(a) Transient signals for selected wavelengths (dots) and fits (lines); (b) Decay associated spectra (DAS) describing the electronic dynamics of the Sb-corrole. DAS1 shows the Soret to Q band transition and rise of the SE of the Q band. DAS2 corresponds to triplet formation. The spectrum with a time constant of 10,000 ps represents the triplet decay and the decay of ground state bleach. The inverted sum of DAS1, DAS3, and DAS4 is presented as relaxed fluorescence (black line), with an added offset to match the signal of DAS2 at 700 nm; (c) two additional DAS showing cooling processes associated with a spectral blue shift and a narrowing of the respective peaks.

