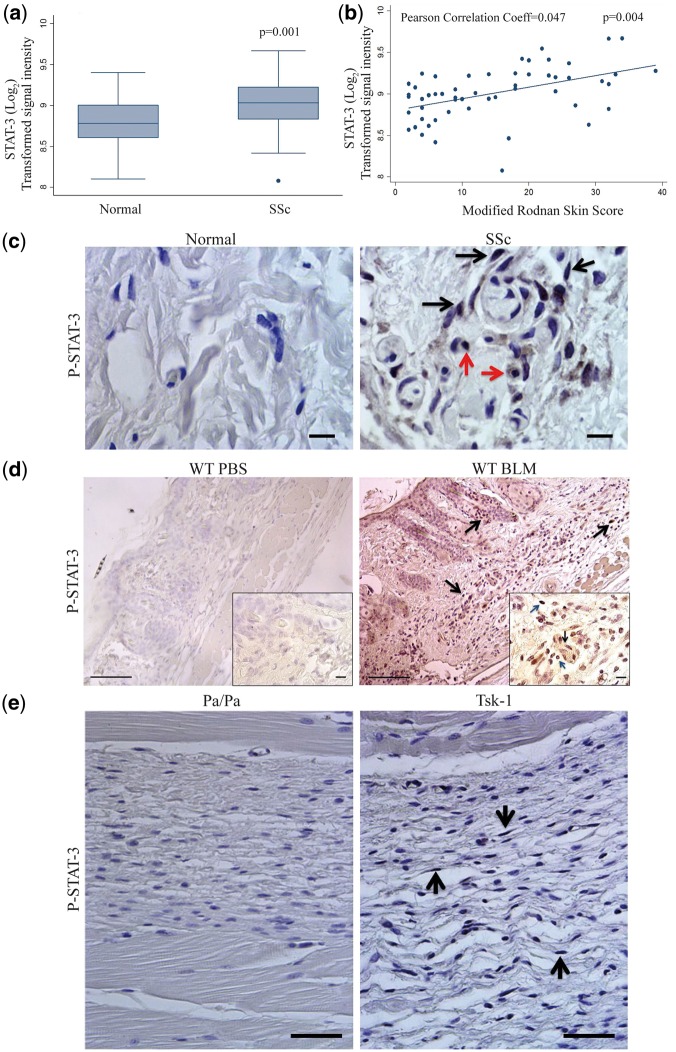
Fig. 1.
Characterization of STAT-3 expression and activation in SSc patients and the bleomycin and Tsk-1 model
(A) Microarray expression profiling STAT3 expression on SSc patients vs normal controls. Data are given as log2 transformed signal intensity from the microarray, mean + s.e.m. (P = 0.001 normal (n = 36) vs SSc (n = 61)). (B) Correlation of modified Rodnan skin scores with STAT3 mRNA expression from the microarray dataset of SSc skin biopsies. N = 54 SSc patients, P = 0.004. (C) Immunolocalization of pY-STAT-3 expression in skin biopsies from healthy control and SSc patients (dermal fibroblasts: black arrows; macrophages: red arrows). Images are representative of five patients from each group. Scale bars: ×100, 10 μm. (D) Immunolocalization expression of pY-STAT-3 in skin sections from wild-type mice treated with PBS and bleomycin (BLM). Dermal fibroblasts are identified by black arrows; macrophages are identified by red arrows. Images are representative of eight mice from each group. Scale bars: ×20, 100 μm; ×100, 10 μm. (E) Immunolocalization of pY-STAT-3 expression was determined on hypodermal fibroblasts in skin sections from Pa/Pa and Tsk-1 mice (black arrows). Images are representative of 10 mice from each group. Scale bars: ×40, 50 μm.

