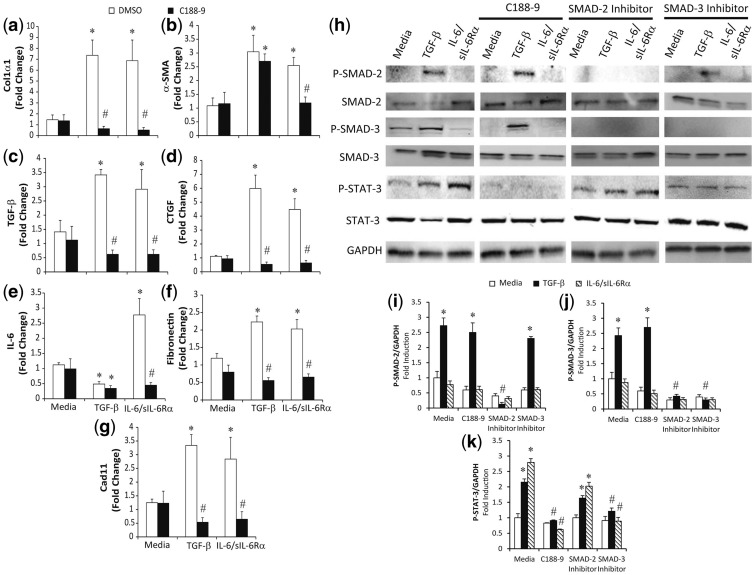
Fig. 6.
STAT3 regulation of cultured fibroblasts and myofibroblasts
Primary dermal fibroblasts were isolated, cultured and subsequently stimulated with TGF-β (10 ng/ml), IL-6/sIL-6Rα complex (20 μg/ml) and C188-9 inhibitor (20 μM). Twenty-four hours later, RNA was isolated and transcripts were determined for Col1α1 (A), α-SMA (B), TGF-β (C), CTGF (D), IL-6 (E), Fibronectin (F) and Cad11 (G). Transcripts were measured in parallel with 18S rRNA, and values are presented as mean of fold change transcripts ± s.e.m., n ≥ 4 (*P ≤ 0.05 Media vs TGF-β, IL-6/sIL-6Rα; **P ≤ 0.05 TGF-β vs TGF-β C188-9; and IL-6/sIL-6Rα vs IL-6/sIL-6Rα C188-9). (H–J) Lysates were obtained from dermal fibroblasts treated for 1 h with different inhibitors (C188-9, 20 μM; SMAD-2 inhibitor, 10 μM; SMAD-3 inhibitor, 10 μM), and subsequently stimulated with TGF-β and IL-6/sIL-6Rα complex. Western blots were performed for total and phosphorylated forms of STAT3, SMAD2 and SMAD3. GAPDH levels were used as a loading control. Phospho-SMAD2 (I), phosph0SMAD3 (J) and phospho-STAT3 (K) band intensities were quantified using Image J analysis. Values are presented as the percentage of GAPDH ± s.e.m., n ≥ 4 (*P ≤ 0.05 Media vs TGF-β or IL-6/sIL-6Rα; **P ≤ 0.05 TGF-β vs TGF-β with either C188-9, SMAD2 or SMAD3 inhibitors or IL-6/sIL-6Rα vs IL-6/sIL-6Rα C188-9).

