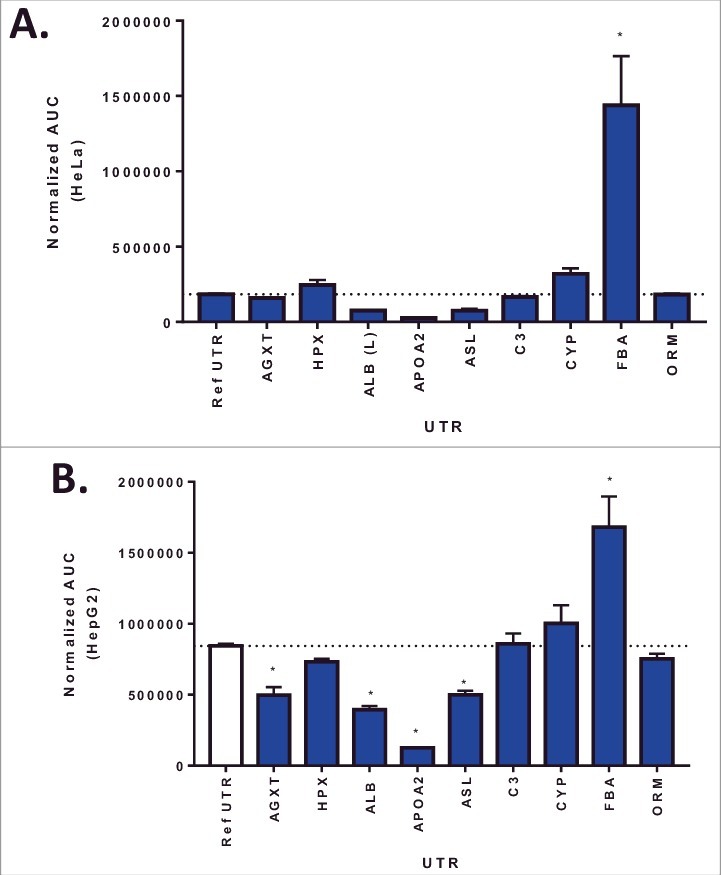
Figure 1.

Arginase I protein expression 72hr following plasmid transfection in HeLa (Panel A) or HepG2 cells (Panel B). Columns represent the mean area under the curve as determined by capillary electrophoresis (± 1STDEV). * = p<0.05 vs reference UTR.
