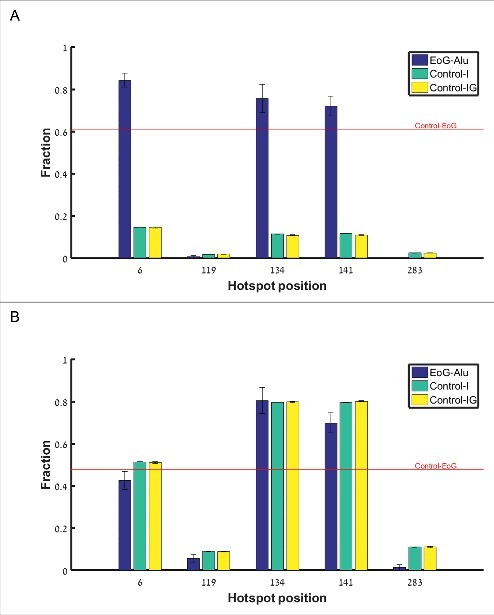
Figure 3.

Fraction of polyadenylation signals upstream of gene ends mapped to the different hotspot positions along the reference Alu sequence (i.e., the number of Alu sequences where polyadenylation signals were found divided by the total number of Alu sequences). Blue –EoG-Alu elements; green –intronic Alu elements (Control-I); yellow –intergenic Alu elements (Control-IG). Red horizontal line represents the fraction of polyadenylation signals within the control set of gene ends (Control-EoG). (A) Canonical polyadenylation signals only, UUAUUU and UAAUUU. (B) Fourteen additional non-canonical polyadenylation signals.
