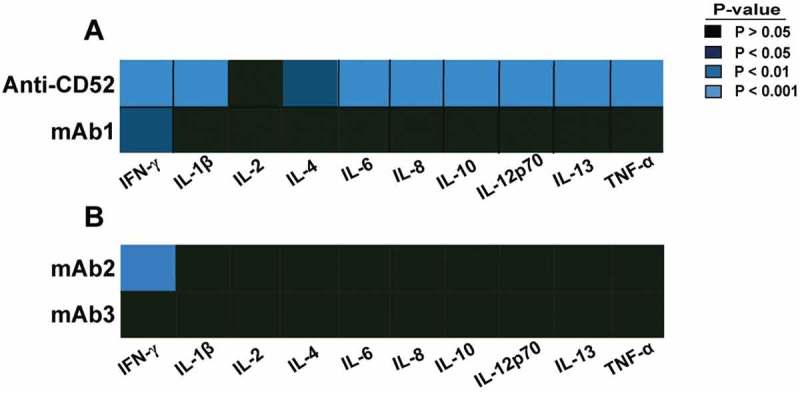
Figure 1.

Cytokine response to IgG1 antibodies with CRS-inducing potential in preclinical whole blood assay. Heat map representation of statistically significant increase of cytokines from whole blood stimulated for 24 h with (A) anti-CD52, mAb1, (B) mAb2, or mAb3. PBS buffer was used as negative control for donor baseline cytokine levels. The response of 10 cytokines was measured by multiplex cytokine analysis. P-values generated by one-way ANOVA followed by paired T-test of log 10 transformed concentrations of treated versus untreated samples. Significant response is only considered if the geometric mean of the fold change to the relative untreated sample is ≥ 2. Donor responses shown are n = 11 (A) and n = 12 (B).
