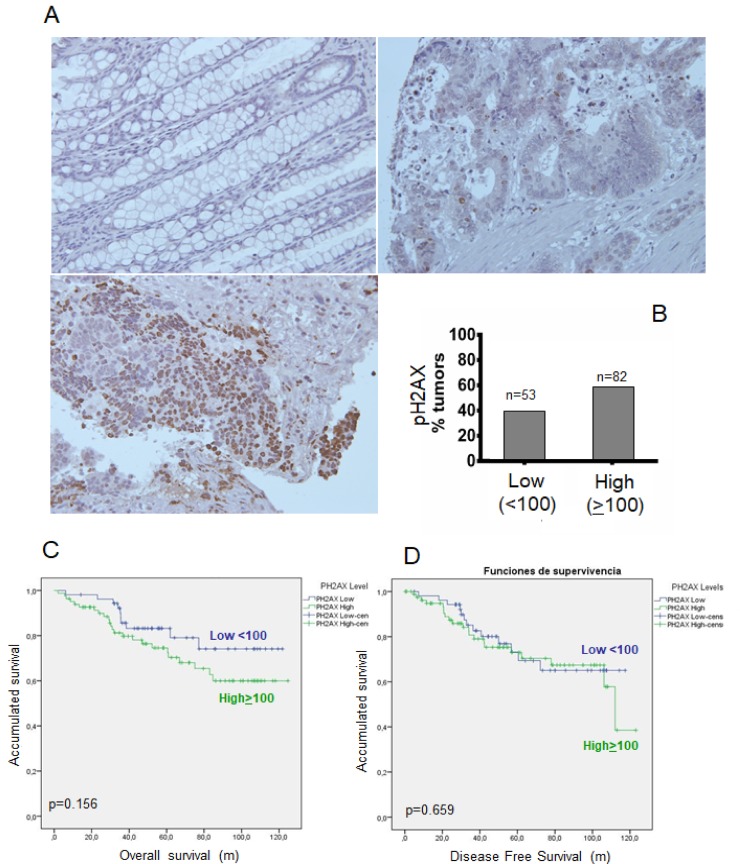
Figure 4. Phosphorylation of γH2AX (p-H2AX) in rectal tumors after concurrent chemoradiotherapy.
(A) Representative pictures of MAP17-stained rectal tumor samples. (B) Percentage of tumors positive and negative for MAP17 in our cohort of rectal tumor samples (n = 135). An ROC curve was used to identify the cut-off point (100). (C) Overall survival (left) and disease-free survival (right) analysis of the rectal tumor cohort (Supplementary Table 1) used in this study. (D) Disease-free survival analysis of the rectal tumor cohort (Supplementary Table 1) used in this study

