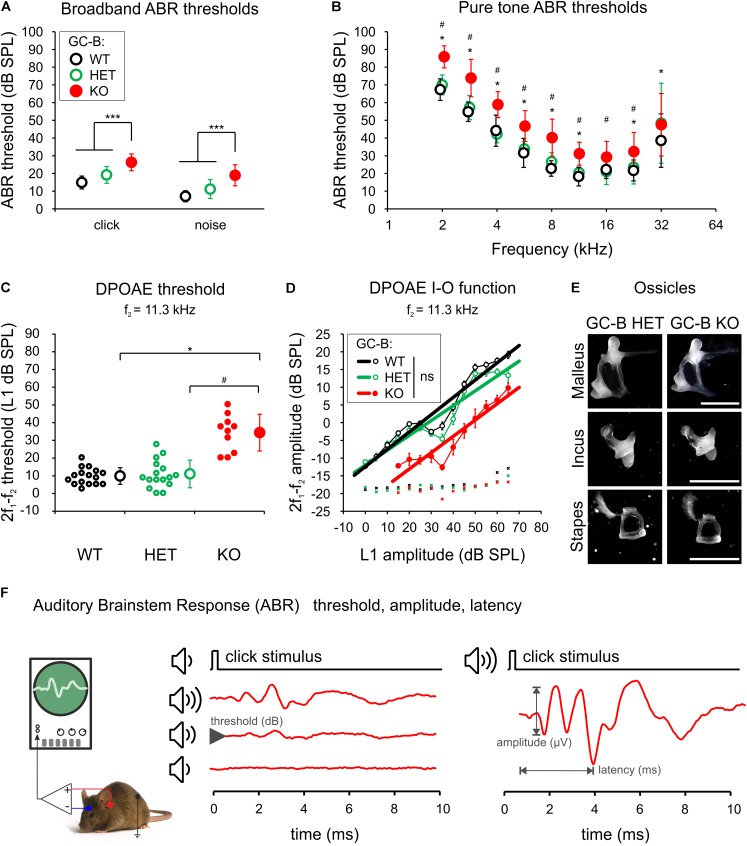
FIGURE 2.
Mild elevation of auditory brainstem response (ABR) and distortion product otoacoustic emission (DPOAE) thresholds in GC-B KO mice but no indication of a conductive hearing loss. (A) Mean ± SD click- and noise-evoked ABR thresholds were significantly different for GC-B KO (red circle) compared to GC-B WT (black open circle) and GC-B HET (green open circle) mice. (B) Pure tone-evoked ABR thresholds significantly differed for GC-B KO and GC-B WT mice (2 – 11.31 and 22.6 – 32 kHz, asterisks) and for GC-B KO and GC-B HET mice (2 – 22.6 kHz, hash signs). (C) Mean ± SD cubic (2f1–f2) DPOAE threshold (open circles with error bars) at the stimulus frequency f2 = 11.3 kHz of GC-B KO mice was significantly elevated compared to GC-B WT and GC-B HET mice (small circles: thresholds of individual mice). (D) Mean ± SD cubic DPOAE input-output (I-O) functions (circles connected by a thin line) for f2 = 11.3 kHz of GC-B WT, GC-B HET, and GC-B KO mice. The DPOAE threshold difference in (C) was reflected by a right-shift of the I–O curve for the GC-B KO mice. No significant difference was found for the linear fit of I–O functions of either genotype (GC-B WT: y = 0.4883x – 12.399, R2 = 0.9363, GC-B HET: y = 0.4191x – 11.986, R2 = 0.8851, GC-B KO: y = 0.4607x – 22.291, R2 = 0.8818, bold lines), indicating no damping effect due to conductive problems in the middle ear. (E) Ossicles of GC-B KO mice did not show obvious malformation or size differences. (F) Scheme of ABR measurement. Scale bars: 1000 μm. The legend keys in (A) apply for (A–C).

