FIGURE 5.
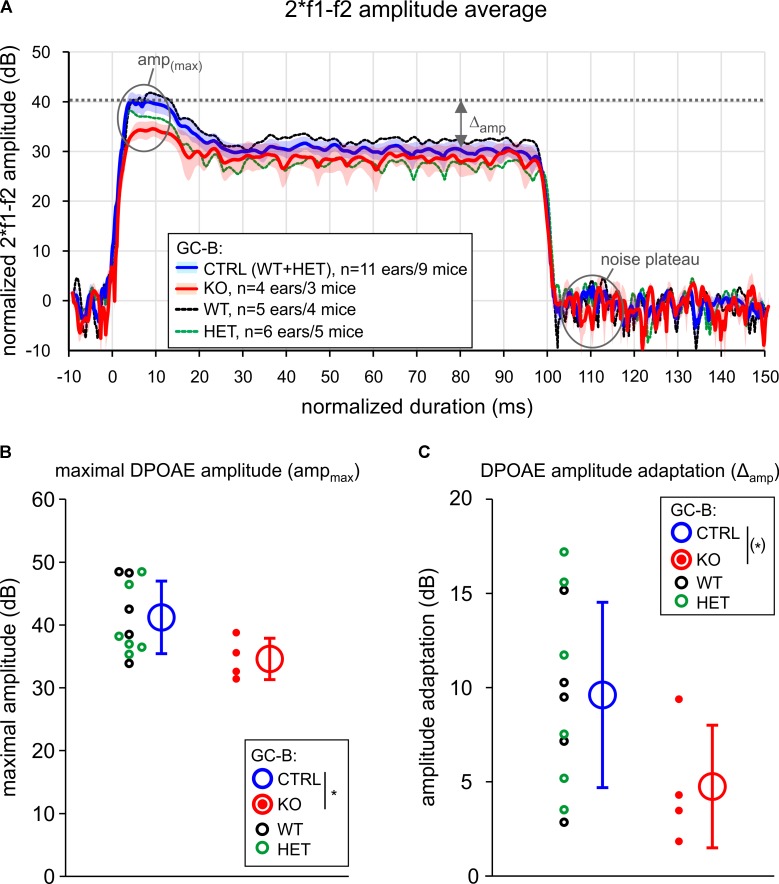
Fast adaptation of distortion product otoacoustic emission (DPOAE) amplitudes was smaller in GC-B KO mice. (A) Time course of the 2∗ f1 – f2 DPOAE amplitude signal over 100 ms stimulation (f2 = 11.3 kHz, L1 = 70 dB) for groups of GC-B WT, HET, and KO mice. The DPOAE amplitude was normalized to noise level (noise plateau = 0 dB). The maximal DPOAE amplitude (ampmax) after primary onset, and amplitude adaptation (Δamp) are indicated. No significant difference for Δamp and ampmax was found for GC-B WT (black) and GC-B HET (green) mice. The groups were therefore combined and served as control group (GC-B CTRL, blue line and shade, mean ± SEM) for comparison to GC-B KO mice (red line and shade, mean ± SEM). (B) Mean ± SD ampmax (open circles and error bars) and (C) mean ± SD Δamp (open circles and error bars) were different in GC-B KO mice (red filled dots: individual ears) when compared to GC-B CTRL mice (black filled dots: individual ears of GC-B WT ears, green filled dots: GC-B HET ears) resulting in a statistical trend for reduced Δamp values (one-sided Student’s t-test, p = 0.0464, with p < 0.05 certified in bootstrap resampling procedures: p = 0.043, resampling with n = 11 and n = 4 for GC-B CTRL and GC-B KO, respectively, 10,000 resamplings, 0.0406 < p < 0.0479 in 20 repetitions). n of analyzed ears/mice: GC-B WT (5/4), GC-B HET (6/5), and GC-B KO (4/3) mice.

