FIGURE 6.
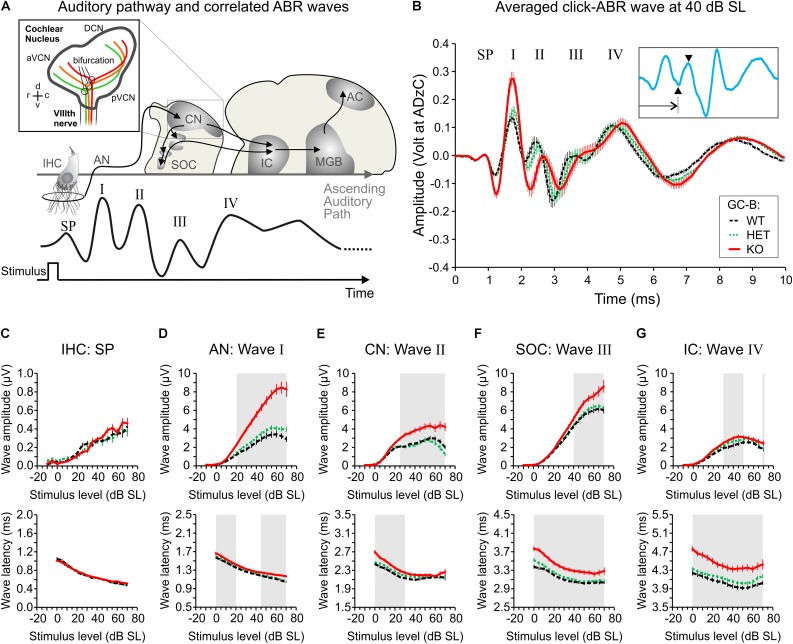
Elevated click-evoked auditory brainstem response (ABR) wave I–IV amplitudes and delayed latencies in GC-B KO mice. (A) Schematic drawing of the auditory pathway and correlated stimulus-evoked deflections of ABR waves summating potential (SP), I, II, III, and IV. The insert illustrates axon bifurcation of auditory nerve (AN) fibers from the VIIIth nerve. d, v, r, c refer to anatomical orientation dorsal, ventral, rostral, and caudal, respectively. aVCN, anterior part of the ventral cochlear nucleus; pVCN, posterior part of the ventral cochlear nucleus; DCN, dorsal cochlear nucleus. Colored projections depict fibers from low (green) to high (red) frequency representing tonotopically organized fibers [insert created according to Lu et al. (2014)]. (B) Mean ± SEM click-evoked ABR waves recorded at 40 dB SL for GC-B WT (black; n = 18), GC-B HET (green; n = 20) and GC-B KO (red; n = 18) mice. The waves corresponding to the SP, wave I, II, III, and IV are marked. The inset shows a representative GC-B HET mouse ABR waveform (blue line) to illustrate how wave latencies and amplitudes are defined. Wave latencies were defined as the time point of the minimum respective to stimulus onset (arrow) and amplitudes were calculated from the difference between minimum and subsequent maximum of each ABR wave (arrowheads). (C–G; upper panels) Mean ± SEM I–O functions of maximum peak-to-peak amplitudes of the SP (C) and ABR waves I (D), II (E), III (F), and IV (G). SP amplitude was not significantly different between genotypes (C). Summed neuronal activity of the AN, CN, superior olivary complex (SOC), and inferior colliculus (IC) was significantly elevated in GC-B KO (D–G, red lines) compared to GC-B WT (black lines) and of the AN, CN, and SOC to GC-B HET (green lines) mice. Note that ABR wave amplitudes are plotted from –10 to 70 dB SL (normalization to threshold) and that the amplitude scale differs for SP amplitudes. (C–G; lower panels) Mean ± SEM I–O functions of ABR wave latencies corresponding to the analyzed peak amplitudes in the upper panels of the corresponding boxes. Wave latency of the SP did not differ between genotypes (C). ABR wave I (D), II (E), III (F), and IV (G) latencies were significantly delayed in GC-B KO compared to GC-B WT and GC-B HET mice. Note that latency is increasing along the afferent auditory pathway. Gray-shaded areas in (D–G) correspond to stimulus intensities with significant difference between GC-B WT and GC-B KO mice. Statistical comparisons are detailed in (Supplementary Tables 2, 3). The legend keys in (B) apply for (B–G).

