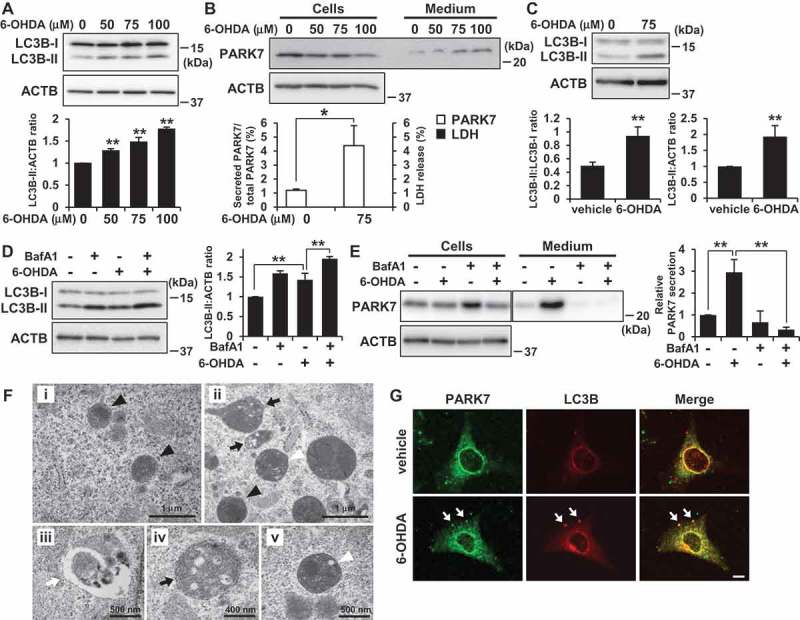
Figure 4.

6-OHDA treatment induced autophagy in SH-SY5Y cells and WT MEF cells. (A) SH-SY5Y cells were treated with 0–100 μM 6-OHDA for 3 h. Whole cell lysates were immunoblotted using antibodies specific for LC3B or ACTB. LC3B and ACTB band intensities were quantified by densitometric scanning and LC3B-II:ACTB ratio is shown. n = 3; mean ± S.D.; **, p < 0.01. (B) WT MEF cells were treated with 0–100 μM 6-OHDA for 3 h and were then cultured in serum-free medium for 2 h. Whole cell lysates and the conditioned medium were immunoblotted using antibodies specific for PARK7 or ACTB. PARK7 band intensities were quantified by densitometric scanning and the percentage of secreted PARK7/total PARK7 is shown. LDH release in the conditioned medium was analyzed by LDH assay. n = 3; mean ± S.D.; *, p < 0.05. (C) WT MEF cells were treated with 75 μM 6-OHDA for 3 h. Whole cell lysates were immunoblotted using antibodies specific for LC3B or ACTB. LC3B band intensities were quantified by densitometric scanning and LC3B-II:LC3B-I or LC3B-II:ACTB ratio is shown. n = 3; **, p < 0.01. (D and E) WT MEF cells were pretreated with 100 nM bafilomycin A1 (BafA1) for 1 h and were then treated with 75 μM 6-OHDA for 3 h (D), followed by culture in serum-free medium for 2 h (E). Whole cell lysates and the conditioned medium were immunoblotted using antibodies specific for LC3, PARK7, or ACTB. PARK7, LC3B and ACTB band intensities were quantified by densitometric scanning. LC3B-II:ACTB ratio (D) and relative secretion level to vehicle-treated cells (E) are shown. n = 3; mean ± S.D.; **, p < 0.01. (F) WT MEF cells were treated with vehicle (i) or 75 μM 6-OHDA (ii-v) for 3 h. Cells were subjected to electron microscopy. Representative images are shown. Black arrowheads indicate lysosome. Black arrows indicate autophagosome/amphisome and lysosome. White arrowhead indicates autolysosome. White arrow indicates phagophore. (G) WT MEF cells grown on coverslips were treated with 75 μM 6-OHDA for 3 h. Cells were processed for immunofluorescence staining with antibody against PARK7 or LC3B. Representative confocal images are shown. White arrows indicate co-localization. Scale bar: 10 μm.
