
Figure 2.
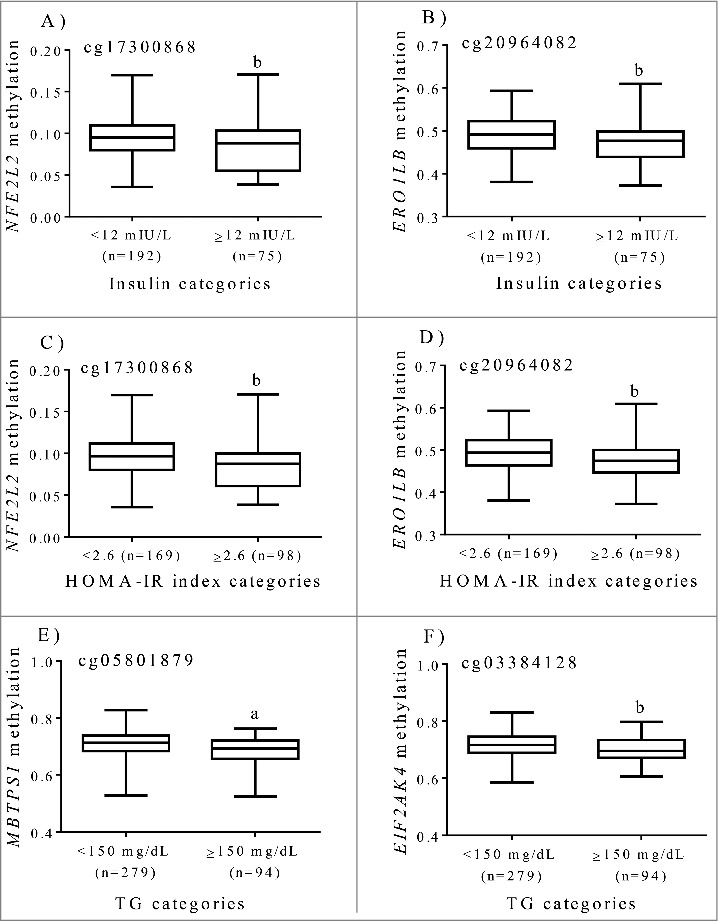
Tenth, 25th, 50th, 75th, and 90th percentiles of methylation levels (beta values) at ER regulatory genes by categories of insulin, HOMA-IR and triglycerides after adjustments for age and sex in subjects with excessive weight. (A) cg17300868, NFE2L2 (B) cg20964082, ERO1LB (C) cg17300868, NFE2L2 (D) cg20964082, ERO1LB (E) cg05801879, MBTPS1 (F) cg03384128, EIF2AK4. a p < 0.0001. b p < 0.05.