
Figure 1.
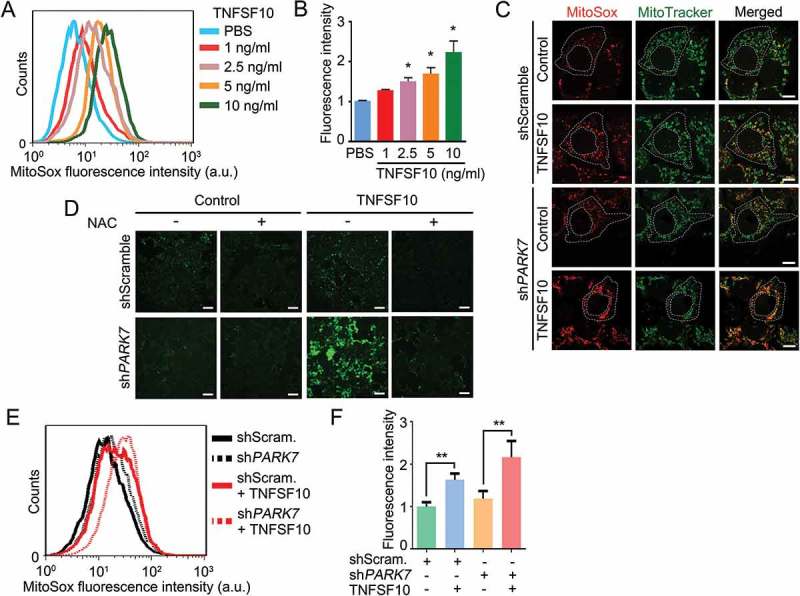
Protective role of PARK7 in TNFSF10-induced oxidative stress. (a) Cells were treated with various concentrations (1–10 ng/ml) of TNFSF10 for 4 h and labeled with MitoSOX Red. The total fluorescence intensity of oxidized MitoSOX Red was measured using flow cytometry. (b) Quantification of A. Error bars represent the mean ± SEM from 3 separate experiments (*p < 0.05). (c) Cells were stably transfected with shScramble or shPARK7 and treated with 10 ng/ml TNFSF10 for 4 h. Mitochondria and cells were stained with MitoTracker Green and MitoSOX Red, respectively. Mitochondria (green) and mitochondrial superoxide anion (red) were detected using confocal microscopy. Scale bar: 10 μm. (d) Cells were stably transfected with shScramble or shPARK7, followed by treatment for 4 h with 2.5 mM NAC, 10 ng/ml TNFSF10 or in combination. Cells were subsequently stained with CM-H2-DCFDA for 30 min. Green signals indicate ROS in the cytosol. Scale bar: 200 μm. (e) Cells were stably transfected with control shRNA (shScram.) or PARK7 shRNA (shPARK7), followed by the treatment with 10 ng/ml TNFSF10 for 4 h. Cells were subsequently labeled with MitoSOX Red, and MitoSOX Red fluorescence was analyzed using flow cytometry. a.u., arbitrary units. (f) Quantification of E. Error bars represent the mean ± SEM from 3 separate experiments (**p < 0.01).