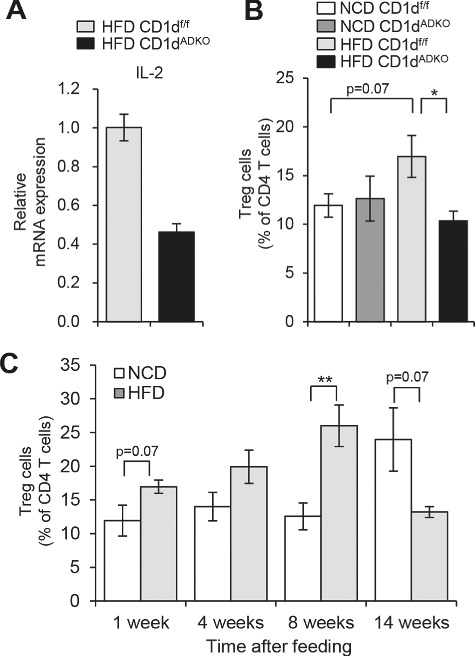
Figure 1.

Analysis of iNKT cells and Treg cells after 1 week of HFD feeding. A: The mRNA level of IL-2 in sorted iNKT cells (TCRβ+PBS57/CD1d tetramer+) from EATs of HFD-fed CDldf/f and CDldADKO mice. EATs were pooled from 15 mice per group. B: The percentage of Treg cells (TCRβ+CD4+Foxp3+) among CD4 T cells in EATs. n = 5. C: The percentage of Treg cells in EATs during NCD and HFD feeding period. N = 4–5. *p < 0.05 and **p < 0.0l. 8-week-old mice were fed NCD or 60% HFD for the indicated time periods.
