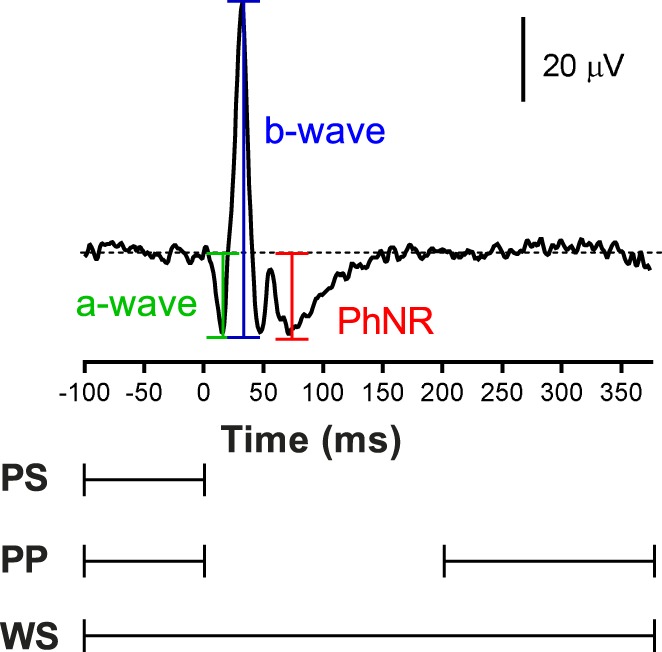
Figure 1.

Measurement of the a-wave, b-wave, and PhNR in the photopic ERG. The parts of the ERG waveform that was fitted with a polynomial of a given order are defined below the graph. PS, prestimulus interval; PP, prestimulus and post-signal interval; WS, whole signal.
