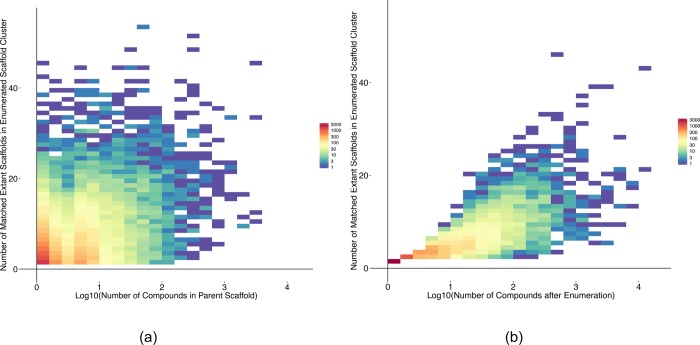
Figure 5.
Heat maps showing (a) the number of matched extant scaffolds after scaffold enumeration plotted against the original number of screening compounds represented by the parent Level 1 scaffolds within the ICR/CRT screening library (n = 23 319). The color key shows the density of unique parent scaffolds that have recorded the same number of matched extant scaffolds after enumeration. (b) The number of matched extant scaffolds plotted against the number of structurally related screening compounds associated after scaffold enumeration for all singleton scaffolds within the ICR/CRT screening library (n = 11 662). The color key shows the density of unique parent scaffolds in each bin.

