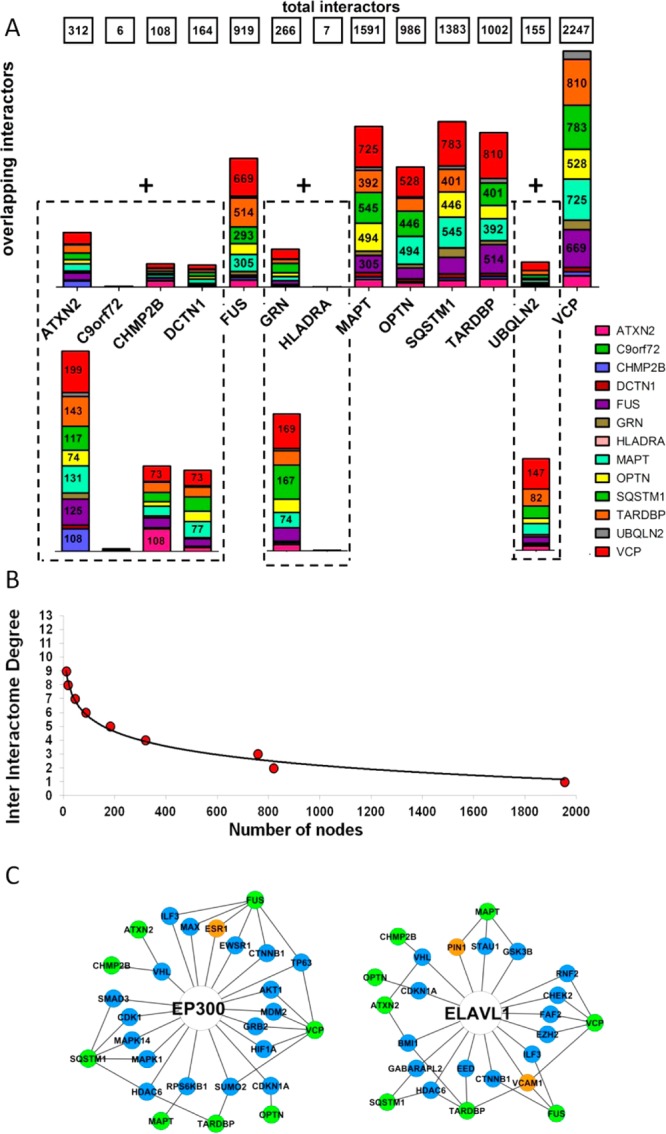
Figure 4.

Level of overlap across interactomes in the first and second layers. (A) Level of overlap across interactomes with two different resolutions to appreciate the architecture of both the large (top) and small (bottom) interactomes. Numbers in the boxes at the top indicate the total dimension (n of interactors) of each single interactome. Numbers in the bars identify the number of shared nodes between two interactomes (where the absence of number indicates <230 [top] and 70 [bottom] shared nodes). (B) Inter-interactomes degree distribution: number of nodes (x axis) as a function of the number of interactomes they belong to (y axis): 29 inter-interactome hubs are shared among 8 to 9 interactomes out of 13 total interactomes (>60%). (C) Example of the IIHs with their surrounding interactors and degree of connectivity across the interactomes of multiple seeds. Color code: green, seeds; blue, first-layer interactors; orange, other IIHs.
