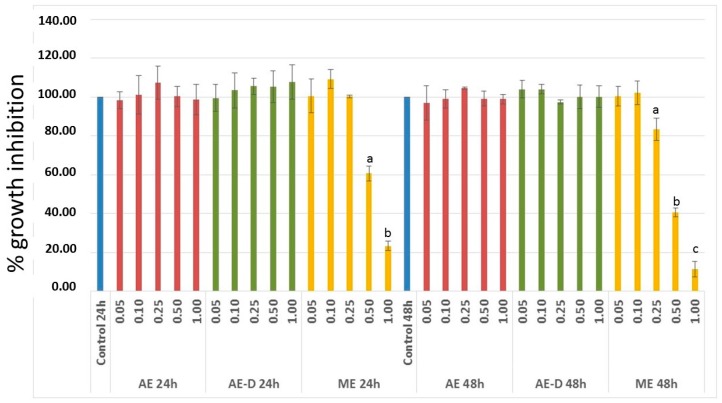
Figure 2.
The effect of aqueous extract (AE), decoction extract (AE-D), and methanol extract (ME) on 3T3-L1 cell proliferation. 3T3-L1 cell proliferation was carried out in the presence or absence of extracts (0, 0.05, 0.1, 0.25, 0.5, and 1 mg/mL). The rate of cell proliferation inhibition was determined using BrdU. The results are expressed as mean ± SD of four determinations. Letters a,b,c, indicate significantly differences between different concentrations and the control according to one way analysis of variance (ANOVA) followed by the Student’s t-test (p < 0.05).

