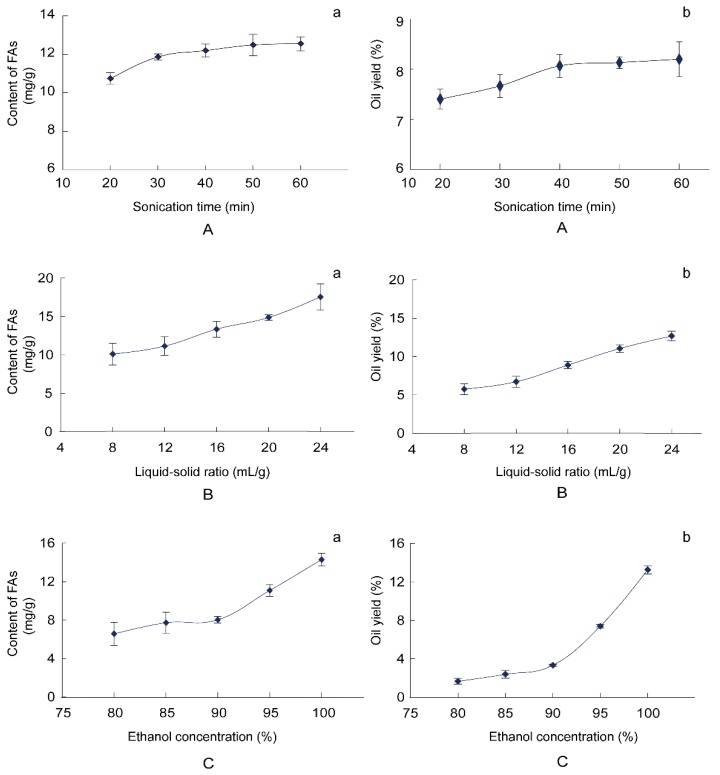
Figure 2.
Effects of different factors on content of FAs and oil yield. The effects of sonication time (min), liquid-solid ratio (mL/g), and ethanol concentration (%) are shown in A, B, and C, respectively. The content of FAs (mg/g) and the oil yield (%) are shown in a and b, respectively. Data are shown as mean ± SD (n = 3).

