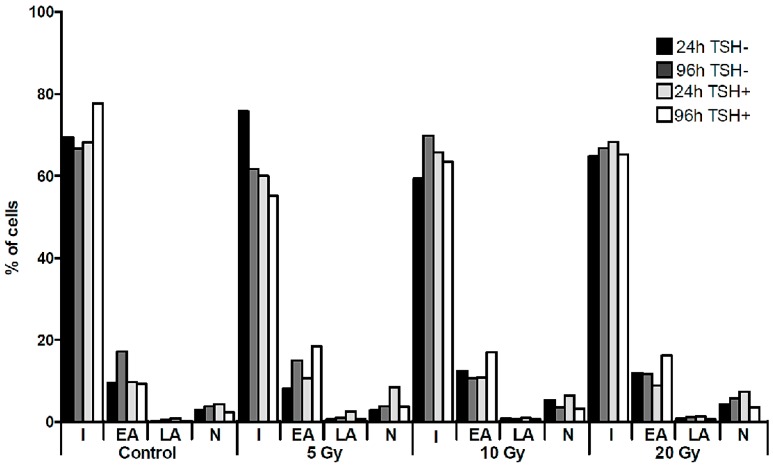
Figure 1.
Cell death of K1 cells in culture with 131I. The graph presents the percentages of K1 cells undergoing apoptotic or necrotic death processes, as assessed by flow cytometry directly after 24 h of 131I exposure (5, 10, 20 Gy) or after additional 72 h of culture without 131I. The culture was performed parallel with or without TSH stimulation. I—intact cells, EA—early apoptosis, LA—late apoptosis, N—necrosis.

