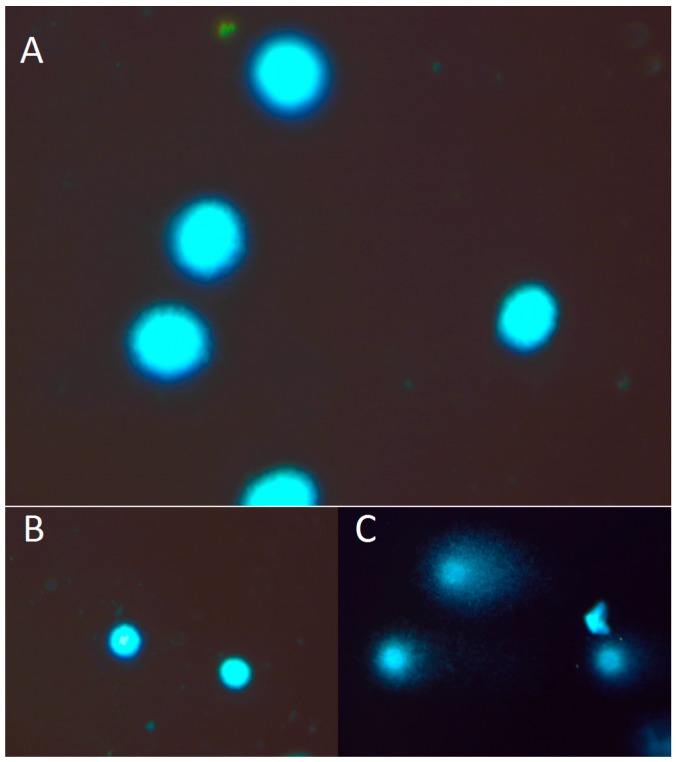
Figure 2.
Representative images of DNA comets, obtained from K1 cells. (A) The picture shows intact DNA heads without the DNA tail. (B) Negative control. (C) Positive control (treated with 15 µM H2O2). The K1 cells were stained with 4′,6-diamidino-2-phenylindole (DAPI), observed in fluorescent microscopy at magnification 400×. DNA damage was calculated as the DNA tail area/whole DNA area (%) and the comet tail length (from the center of DNA head to the end of the DNA tail).

