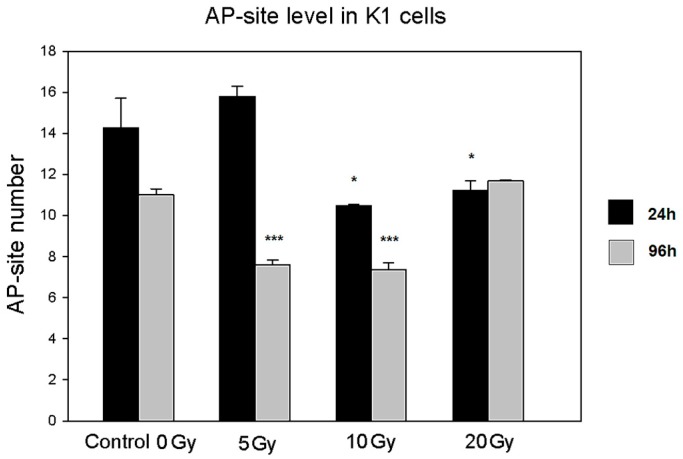
Figure 6.
AP-site level in K1 cells cultured with 131I. The graph presents AP-site level (AP-sites/100,000 bp ± SD) in DNA measured in samples obtained from cultured K1 cells directly after 24 h of 131I exposure (5, 10, and 20 Gy) or after additional 72 h of culture without 131I (* p < 0.05; *** p < 0.001).

