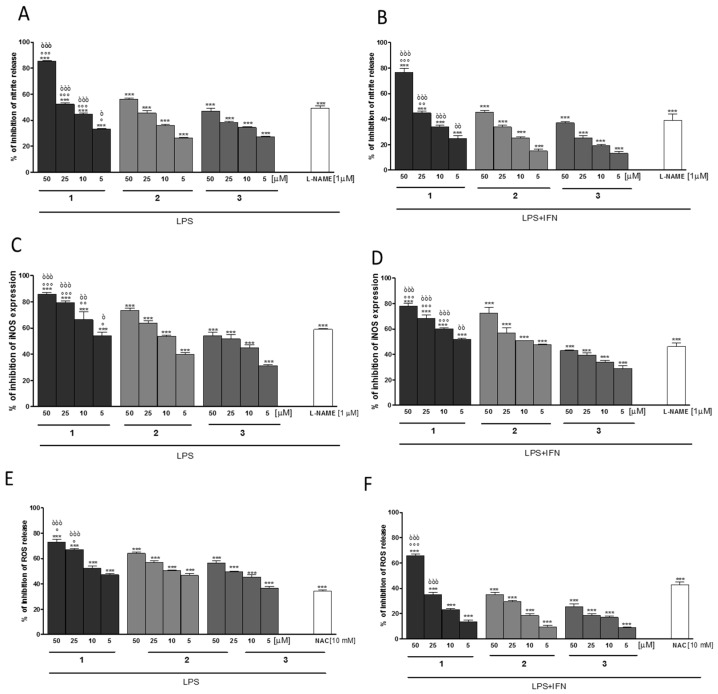
Figure 6.
Effect of compounds 1–3 (5–50 µM) on nitrite release (A,B), iNOS expression (C,D), and on ROS production (E,F), in J774A.1 macrophages (A,C,E) and C6 astrocytes (B,D,F) after 24 h. Data are expressed as mean ± S.E.M.; *** denotes p < 0.001 vs. LPS (1 μg/mL) or LPS + IFN-γ (1 μg/mL; 100 U/mL). °°°, °°, ° denote p < 0.001, p < 0.01, p < 0.05 vs. 2. òòò, òò, ò denote p < 0.001, p < 0.01, p < 0.05 vs. 3. L-NAME (1 μM), used as positive control for NO and iNOS inhibition gave a percentage of inhibition of 49.00 ± 2.08% for nitrite production of and a percentage of inhibition of 59.00 ± 0.74% of iNOS expression in J774A.1 macrophages. In C6 astrocytes, L-NAME gave a percentage of inhibition of 39.33 ± 4.37% and 46.21 ± 2.65% of nitrite production and iNOS expression, respectively. NAC (10 mM) was used as positive control for ROS release and gave a percentage of inhibition of ROS production of 34.50 ± 0.50% in J774A.1 macrophages and 43.33 ± 1.45% in C6 astrocytes.

