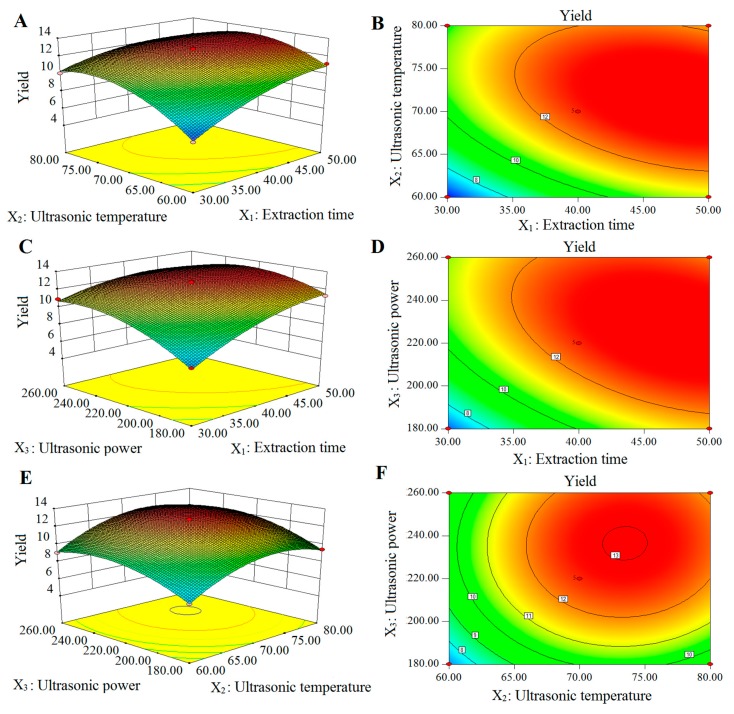
Figure 3.
The 3D response surface and 2D contour plots showing the effects of extraction factors on the yield of PSA. (A,B) were 3D response surface and 2D contour plots showing the effects of extraction time and ultrasonic temperature on the yield of PSA; (C,D) were 3D response surface and 2D contour plots showing the effects of extraction time and ultrasonic power on the yield of PSA; (E,F) were 3D response surface and 2D contour plots showing the effects of ultrasonic temperature and ultrasonic power on the yield of PSA.

