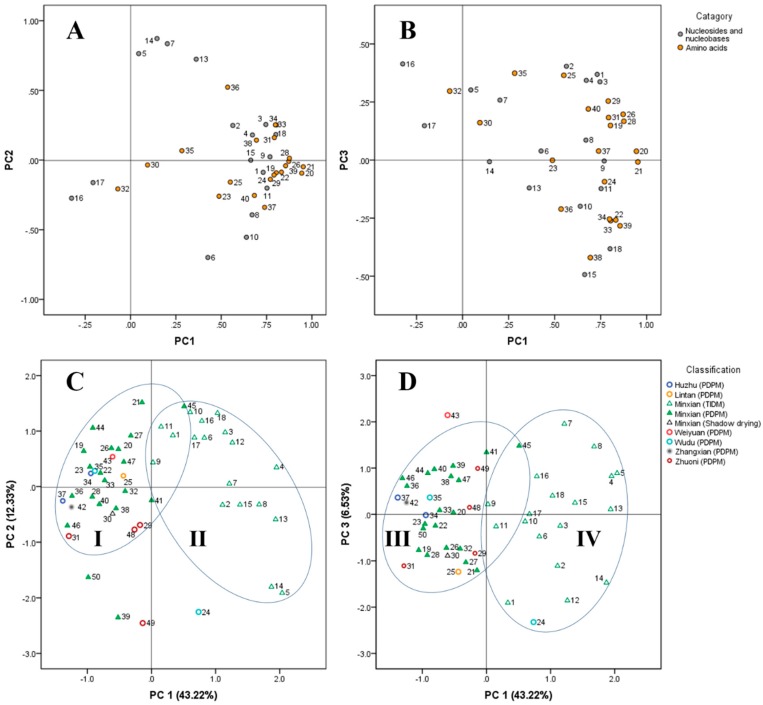
Figure 3.
Loading plots and scatter plots obtained by PCA. (A) Loadings on PC 1 and PC 2 of all the analytes except for guanine and taurine; (B) Loadings on PC 1 and PC 3 of all the analytes except for guanine and taurine; (C) Scatter plots of the 50 ASR samples; (D) Scatter plots of the 50 ASR samples.

