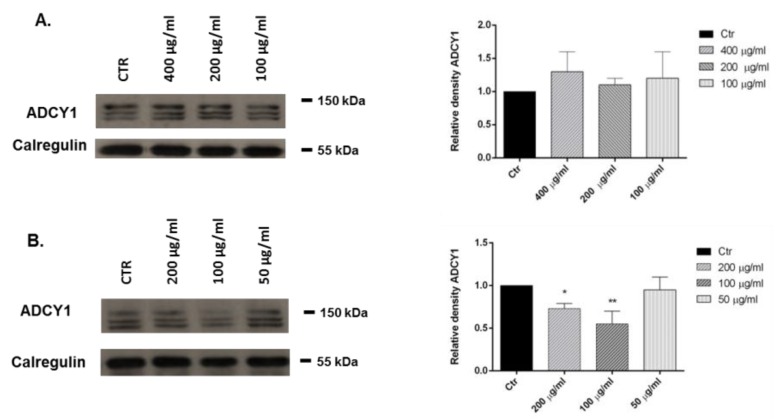
Figure 2.
Relative expression levels of the ADCY1 protein in SH-SY5Y cells treated with 1,8-cineole (A) and Laurus nobilis essential oil (B). Each panel shows the densitometry of bands in the treated groups and control. Values are the mean ± SD in each group (n = 3). * p < 0.05, compared to control (ANOVA followed by Dunnett’s multiple comparison test).

