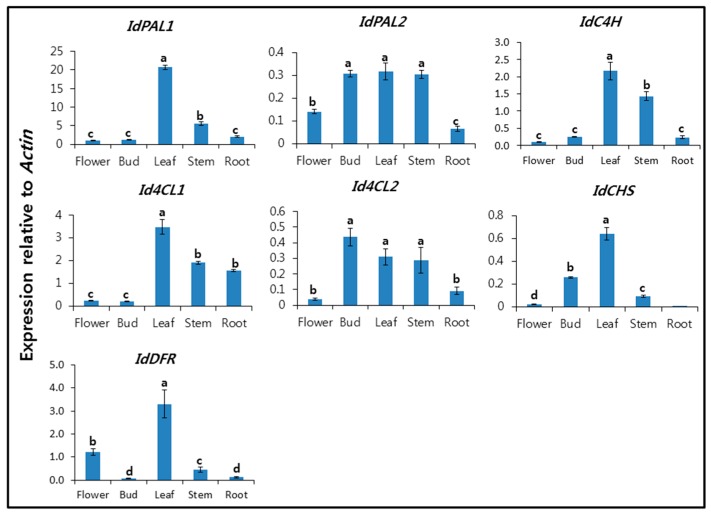
Figure 1.
Expression levels of IdPALs, IdC4H, Id4CLs, IdCHS, and IdDFR in the flower, bud, leaf, stem, and root of I. dentata. Each value is the mean of three biological replicates, and error bars indicate standard deviation. Lower-case letters indicate statistically significant differences (p < 0.05) between different organs according to Duncan’s Multiple Range Test (n = 5).

