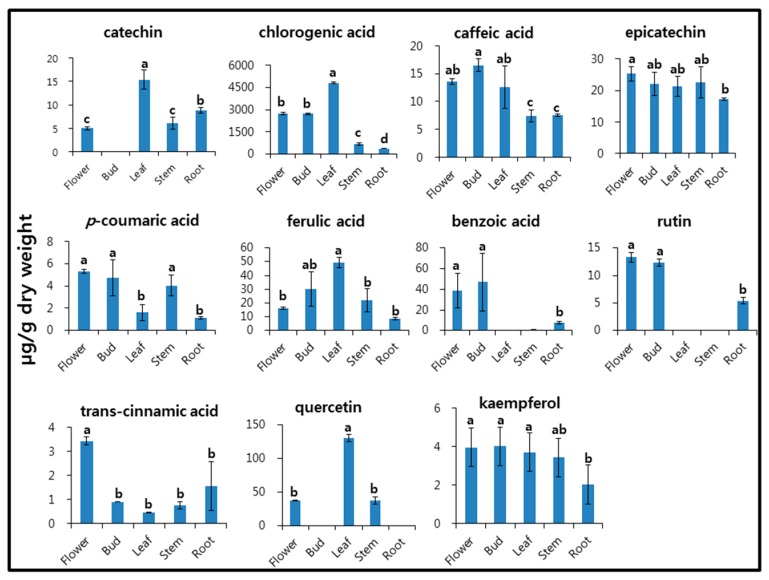
Figure 2.
Accumulation of phenolic compounds in different organs of I. dentata. Each value is the mean of three biological replicates, and error bars indicate standard deviation. Lower-case letters indicate statistically significant differences (p < 0.05) between different organs according to Duncan’s Multiple Range Test (n = 5).

