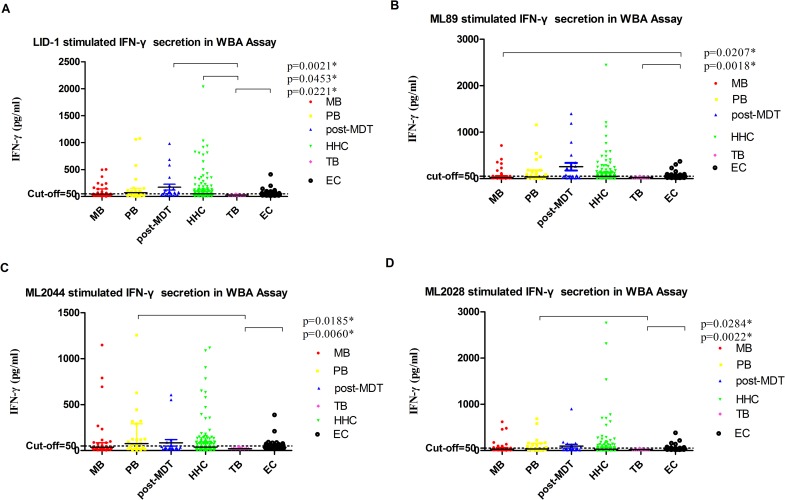
Fig 2. Scatter-dot plots of host IFN-γ detected in antigen-specific overnight WBA supernatants.
Differences in analyte levels were evaluated by the Mann Whitney U test for non-parametric data analysis. Representative plots show the levels of analytes in the overnight whole blood culture supernatants of participants with leprosy (MB, PB and post-MDT) and without leprosy controls(HHC, TB and EC). Bars in the scatter-dot plots represent the median plus interquartile range of the analyte concentration. M.leprae Ag: LID-1(A), ML89(B), ML2044(C), ML2028(D); IFN-γ: Interferon gamma.

