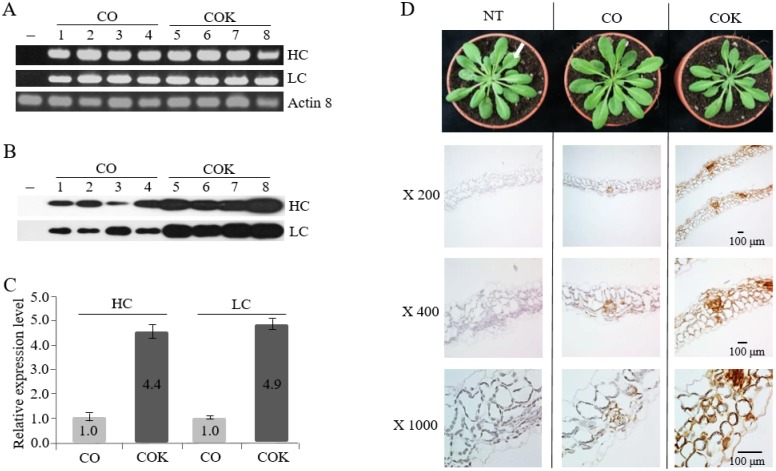
Fig 6. Effects of the ER retention motif on the expression and distribution of mAbs in transgenic Arabidopsis plants expressing mAb CO and mAb COK.
(A) RT-PCR and (B) western blot analyses were performed to confirm HC and LC expression based on RNA and protein expression levels. Lane 1: non-transgenic (NT); lanes 2–5: transgenic plants expressing mAb CO; and lanes 6–9: transgenic plants expressing mAb COK. (C) Relative expression levels of HC and LC determined by immunoblot analyses. Values represent the mean for each experimental group, and SD is indicated by error bars. (D) Intracellular distribution of mAb CO and mAb COK in the rosette leaf tissues of transgenic Arabidopsis plants. Freshly harvested rosette leaf tissues (indicated by a white arrow) were fixed in 10% formalin overnight and processed for paraffin embedding. A Dako REAL EnVision Detection System was used, according to the manufacturer’s instructions, and samples were then counterstained with Mayer’s hematoxylin. Lane 1: non-transgenic (NT) plant; lane 2: mAb CO; and lane 3: mAb COK. Slides were observed under a microscope (magnification: ×200, ×400, and ×1000; BX53F; Olympus, Tokyo, Japan)]. Scale bar represents 100 μm.

