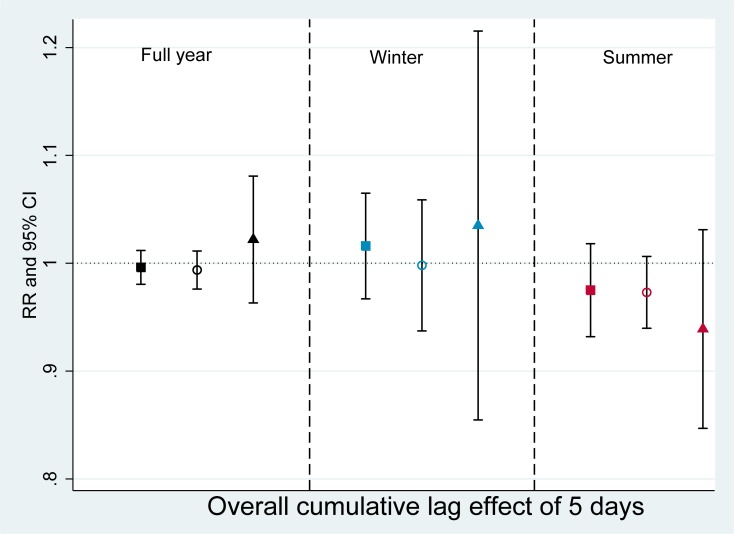
Fig 3. Association between O3 and hospital admissions for wheeze-associated disorder (Overall cumulative lag effect of 5 days).
RR: risk ratio, CI: confidence interval. Black square: full year, all ages; Blue square: winter, all ages; Red square: summer, all ages. Black hollow circle: full year, <5 years old; Blue hollow circle: winter, <5 years old; Red, hollow circle: summer, <5 years old. Black triangle: full year, >65 years old, Blue triangle: winter, >65 years old; Red triangle: summer, >65 years old.

